

Observability for a Site That Only Breaks Occasionally
Website monitoring for a quiet site fails quietly too. Alert on the symptoms a visitor would feel, keep four signals rather than forty, and check the whole setup on a schedule.
On This Page
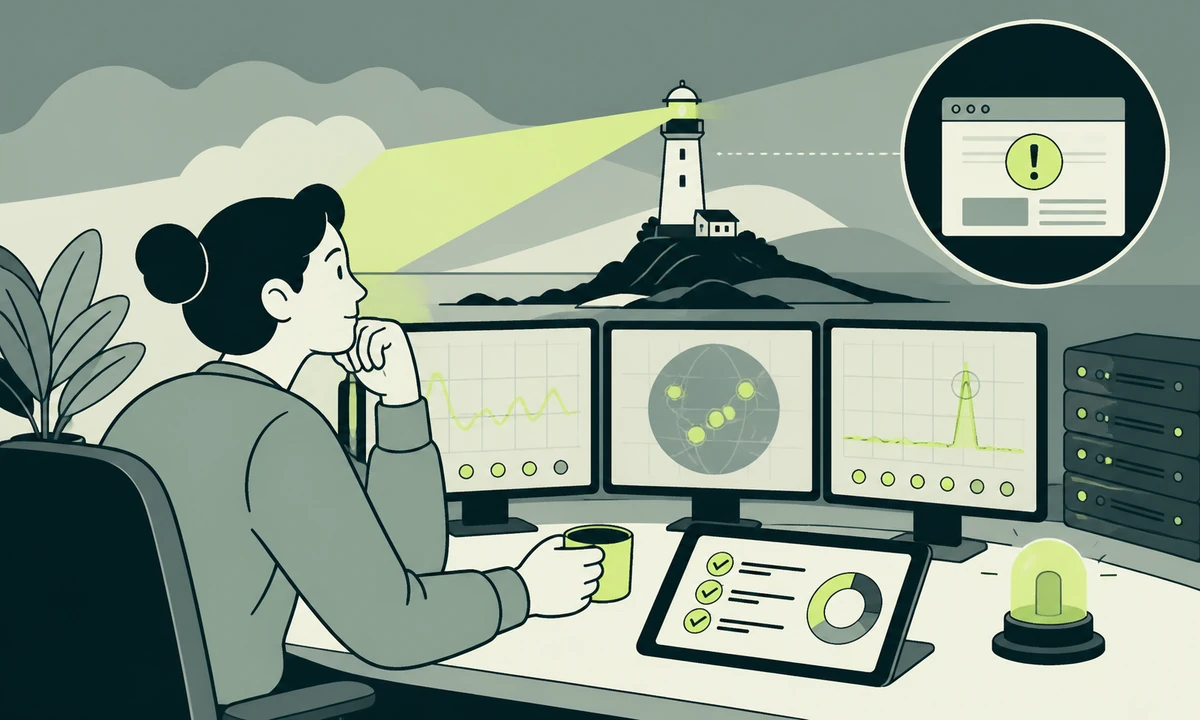
The site went down for a few minutes one Tuesday afternoon and you found out because somebody sent a screenshot from their phone. That is the whole monitoring story for a great many small sites, and it holds up better than anyone admits. Right until the day the checkout breaks in one browser, or the contact form starts posting into nothing, and no screenshot arrives because on the surface nothing looks wrong at all.
Website monitoring for a system that rarely breaks is a genuinely different problem from monitoring one that breaks weekly. The busy system trains you: alerts fire, people respond, bad rules get tuned out of existence within a month. The quiet system does the opposite. It decays without ever telling you it is decaying, because nothing has tested it since the day it was installed.
So this is not an argument for more tooling. Most small sites are already paying for three overlapping products and reading none of them. It is an argument for four signals, chosen deliberately, wired to alert on things a visitor would actually notice, and reviewed on a schedule somebody keeps.
The particular failure mode of a quiet site
A monitoring setup that never fires looks identical to a monitoring setup that has stopped working. There is no difference in the interface. Both show a calm dashboard and a green tick, and the second one has been lying since a config change in the spring.
The decay is mundane and it repeats. The alert channel gets archived during a tidy-up. The webhook points at a chat workspace nobody has opened in eight months. The check runs against a staging URL that was promoted and then retired. The card on the monitoring account expires and the free tier silently stops sending notifications. None of this is negligence. It is what happens to any system with no feedback loop attached.
The most common version, though, is a person. The engineer who set it up moved on, and the alerts still route to an address only they could read. That is the same problem as any other stale credential, and it deserves the same treatment as everything covered in passwords, keys and the people who left: alerts route to a role, never to a person, and the routing gets tested when the person changes.
Alert on symptoms, not on causes
This is the position the rest of the article rests on, so here it is plainly. An alert should describe something a visitor experienced, not something a machine measured. Memory at eighty per cent is a cause. A visitor who could not submit the enquiry form is a symptom. Alert on the second one and you will be woken up less often and be right more often.
What a symptom alert looks like
- The page did not answer. A request from two separate locations failed to return a successful response within a stated number of seconds.
- The page answered with the wrong thing. A successful status code came back, but the string that proves the page rendered was missing from the body.
- A real person hit an error. Errors from actual browsers on a page that matters, grouped and counted, rather than every exception ever thrown.
- A form submission did not arrive. The single highest-value failure on most marketing sites, and the one almost nobody monitors, because it fails without an error page.
- The certificate is close to expiring. Not a symptom yet, but the one scheduled outage you can always prevent, so it earns its place on the list.
Why cause alerts rot faster
Cause alerts encode assumptions about infrastructure, and infrastructure moves. You set a disk threshold, then move to a managed platform where disk is not yours to worry about. You alert on worker counts, then the platform starts scaling them for you and the number stops meaning anything. Each of these alerts survives the change, keeps firing, and gets muted. Every muted alert makes the next real one slightly less believable.
Symptoms are stable because they are defined from outside. Whether a visitor can load a page and submit a form is true regardless of what the stack is made of. The check you write today is still meaningful after a replatform, which is a rare property in operational tooling and worth optimising for.
An alert nobody has ever acted on is not monitoring. It is a subscription to your own noise.
Uptime checks: cheap, useful, and easy to get wrong
The uptime check is the first thing to set up and the least interesting to talk about. It catches the failures that are total and obvious: expired domain, broken DNS, origin refusing connections, a deployment that returns a server error on every route, a certificate nobody renewed.
It misses almost everything else. A page that takes fourteen seconds to render passes. A page whose JavaScript throws on load and shows a blank white area passes. A form that posts to a deleted endpoint passes, because the page itself is fine. A page serving a friendly “something went wrong” message with a successful status code passes twice over.
Make the check assert something
Two changes turn an uptime check from a formality into a real signal. First, assert on content: require a specific string that only appears when the page has rendered properly. Second, point at least one check at a route that exercises the parts you care about, not at the homepage, which on a cached site can be served long after the origin has stopped answering for anything dynamic.
A cached page, a custom error template and a CDN fallback all return a successful status code while the thing behind them is broken. If your check only reads the status code, it will report perfect availability throughout an outage. Assert on a string in the body, and choose a string that comes from the database rather than from the template.
Real user monitoring is the signal that argues back
Synthetic checks tell you what a well-connected robot in a data centre experienced. Real user monitoring tells you what happened on a five-year-old Android phone on a train. These two frequently disagree, and when they do, the phone is right, because the phone is a customer.
What is worth collecting
Keep it to the field metrics that describe loading, responsiveness and visual stability, segmented by device type and by template rather than by individual URL. Page-level detail is a trap on a small site: you end up with a hundred rows of noise and no pattern. Template-level detail tells you that product pages regressed while article pages did not, which is a sentence you can act on the same afternoon.
Sample rate matters less than most people fear. A small site does not need every session; it needs enough sessions to see a shift after a deploy. What matters far more is that the data carries a release identifier, so a regression can be traced to the change that caused it rather than to the week it appeared in.
Where this stops being analytics
Analytics answers what people did. Real user monitoring answers what the software did to them while they were doing it. The two overlap in the tooling and not in the question, which is why they belong in different reviews. Behavioural questions sit with strategy and analytics; performance and error questions sit with whoever can deploy. Mixing them produces a monthly meeting where nobody owns anything.
There is a further reason to keep performance data close to the people who can act on it. Slow pages rarely produce a complaint; they produce a quieter departure that shows up much later in a retention number. That is the same argument as churn being a lagging indicator, applied to infrastructure instead of product. By the time the outcome moves, the cause is months old.
Error tracking, and how to stop it becoming noise
Error tracking is the signal small teams adopt enthusiastically and abandon within two months, and the reason is always the same. Unfiltered, it reports browser extensions injecting scripts, ad blockers cancelling requests, bots executing nonsense, and a long tail of exceptions from devices you will never support. The channel becomes unreadable, so it becomes unread.
The fix is an ignore list maintained deliberately in the first fortnight, then rarely touched. Filter out errors originating from extension protocols, from third-party scripts you do not control, and from browsers below whatever floor you have decided to support. Filter cancelled navigations. What remains is small, and small is the point.
Then tag every event with the release. An error group that appears at a version boundary is a regression with an obvious owner; the same group appearing gradually across many versions is an environment problem. That distinction saves more time than any dashboard, and it costs one line in the deployment configuration of most web application builds.
Server-side errors deserve a lower tolerance than client-side ones. A single unhandled exception on a checkout route is worth an alert at any hour. A hundred client-side errors from one visitor with an unusual browser configuration are worth a weekly glance and nothing more than that.
Logs: how much, and for how long
Log retention is a budget decision disguised as a technical one. The real question is how far back you need to be able to investigate, and for a small site the honest answer is usually shorter than the default plan you were sold. Two weeks of searchable application logs covers nearly every question you will actually ask. Anything older is either an audit requirement, in which case it belongs in cheaper cold storage, or it is nostalgia.
Access logs are the exception worth keeping longer, because abuse investigations and traffic disputes both look backwards further than debugging does. Keep them, keep them compressed, and keep them somewhere that costs almost nothing per month rather than in the searchable tier where every gigabyte is priced for querying you will never do.
| Signal | Catches | Misses | Keep for |
|---|---|---|---|
| Uptime check with content assertion | Total outages, bad deploys, expired certificates | Slowness, client-side failures, broken forms | A rolling year of incidents |
| Real user monitoring | Regressions on real devices and networks | Anything that stops the page loading at all | Thirteen months, for year-on-year |
| Client error tracking | JavaScript failures on real browsers | Server faults, silent delivery failures | Ninety days |
| Server and application logs | The detail behind an error you already know about | Anything nobody thought to log | A fortnight, searchable |
| Access logs | Abuse patterns, crawler behaviour, traffic disputes | Application state and visitor intent | Months, compressed and cold |
| Form or delivery check | The enquiry that never reached an inbox | Everything that is not the form | As long as the enquiries matter |
Website monitoring sized for a small site
Here is the order we would build it in. Each step is useful on its own, which matters, because setups assembled all at once tend to be abandoned all at once.
- One uptime check that asserts on content. From two locations, on a route that touches the database, alerting to a shared address rather than to an individual.
- Certificate and domain expiry warnings. Set at a fortnight and at a month. This is the only outage you can schedule out of existence, so do it early.
- A delivery check on every form. Submit a test enquiry on a schedule and assert that it arrived where it is supposed to arrive, not merely that the page said thank you.
- Error tracking with an ignore list from day one. Filter extensions and third-party noise before anyone forms the habit of skimming past the channel.
- Field performance data, tagged by release. Segment by template and device class. Ignore individual URLs until a pattern tells you which one to open.
- A written runbook, three paragraphs long. Who is contacted, where the status message goes, and what is said publicly in the first ten minutes.
Six items, and five of them run without a human. That is roughly the correct split, and it follows the same rule as everything else in what you can safely automate in a small team: automate the detection, keep the judgement.
The half hour that makes the whole thing worth having
Put thirty minutes in the calendar, monthly, with one named owner. Open every alert channel and confirm something arrived, even if it was only a test. Trigger one alert deliberately and watch it land. Read the error groups that appeared since last time. Look at the performance trend by template. Then close the laptop.
Treat a muted alert as a defect rather than as housekeeping. If a rule was noisy enough to mute, it was wrong, and it should be rewritten or deleted rather than silenced. The same instinct applies to whatever scans or audits run alongside this: a raw list is not a plan, which is why tooling such as Prooflin resolves findings into severities, priorities and reviewable reports instead of leaving them as a wall of output nobody triages.
It also helps to remember what the review is for. Nobody buys availability; they buy the thing the site does for them, which our parent company argues at length in what a company actually sells. Monitoring exists to protect that promise, and a signal that cannot be tied back to it is a candidate for deletion.
Some of what the review turns up will be debt, and not all of it needs paying. A noisy check on a page nobody visits can stay noisy for another quarter. We have written about that judgement in technical debt you should keep, and the same reasoning holds for observability: fix what obscures a real failure, and leave what merely offends you.
Where we would start, and when this advice reverses
If you have nothing today, do two things this week: an uptime check that asserts on a string drawn from the database, and a scheduled test submission through every form. Those two catch the failures that cost money, and together they take an afternoon. Everything else is an improvement on a system that already works, and improvements are much easier to justify than beginnings.
The honest concession: symptom-based alerting is worse at prediction. Cause metrics genuinely can warn you before a disk fills or a connection pool exhausts, and a team running its own infrastructure at scale should watch both. The argument here is about proportion, not principle. A small site on a managed platform gets almost nothing from cause alerts except a habit of ignoring notifications, and that habit is expensive later.
The other case where this reverses is a handover. If the people who built the site are leaving, cause-level detail becomes documentation, and it is worth capturing even if nobody alerts on it, for the reasons set out in handing a codebase to someone who was not there. A dashboard nobody watches can still be the fastest way to explain how a system behaves under load.
Whoever ends up on call, write down who that is. Monitoring without an owner produces a green dashboard and a long outage, which is the worst combination available. If you would rather that ownership sat with people who do it every day, that is what ongoing maintenance is for, and you can tell us what breaks if you want a second opinion on the setup you already have.
Common questions.
What is website monitoring?
Website monitoring is the practice of continuously checking that a site is reachable, correct and fast enough for real visitors, and being told when it is not. A workable setup for a small site combines an uptime check from more than one location, performance data collected from real browsers, error tracking, and enough log retention to investigate whatever an alert was pointing at.
What is the difference between synthetic monitoring and real user monitoring?
Synthetic monitoring runs scripted checks from servers you choose, on a schedule you set, so it is consistent and works even with no traffic at all. Real user monitoring collects measurements from the browsers of actual visitors, so it reflects genuine devices, networks and locations. Synthetic checks tell you whether the site is up. Real user data tells you what using it felt like.
How often should an uptime check run?
Every one to five minutes is the usual range, and the interval matters less than the assertion. A check every minute that only reads the status code will miss a broken page that still returns a success response. A check every five minutes that verifies a string rendered from the database will catch far more, at a lower cost and with fewer false alarms.
How long should we keep server logs?
For a small site, roughly two weeks of searchable application logs answers almost every question you will ask during an investigation. Keep access logs longer, compressed and in cheap storage, because abuse and traffic questions look further back than debugging does. If a regulator or a contract requires a longer period, treat that as archival storage rather than as active logging.
Do we still need error tracking if we already have analytics?
Yes, because they answer different questions. Analytics records what visitors did, aggregated into sessions and events. Error tracking records what the software failed to do, with a stack trace, a browser, a release version and a count. An analytics dashboard can show a drop in form completions without ever telling you that a script threw an exception on one browser.
Who should receive monitoring alerts in a small team?
Send alerts to a shared address or channel that at least two people can read, never to one individual. Name a single owner who is responsible for responding, and rotate that ownership if more than one person can deploy. Test the routing whenever someone joins or leaves, because alerts addressed to a departed colleague are the most common way a monitoring setup fails silently.
Facing this in your
own business?
Tell us where you’re headed — we’ll map the shortest honest route.